16. Springboot3+Vue3实现echarts数据统计
统计哪些数据
- 统计不同分类下用户发布旅游攻略帖子的数量(反映出:大家比较喜欢去哪类的旅游景点)-饼图
- 统计不同用户发布帖子数量Top5(反映出:平台活跃用户Top5)-柱状图
- 统计最近一周每天平台用户发布的帖子数量(反映出:每天的活跃情况)-折线图
统计是解决一些实际数据的整合或者反馈出的一些现象,所以它要具有一些实用的意义。
如何去把玩一个统计图
- 去官网体验一下
- 改一改它的数据,找到该统计图所需要的数据在哪个地方
- 分析该数据的结构(数据结构)重要!!
饼图数据部分的数据结构:
data: [
    { value: 1048, name: '风景名胜' },
    { value: 735, name: '历史古迹' },
    { value: 580, name: '人文景观' }
],
前端:[ ] 表示一个数组(对应多条数据),{ } 表示一个对象(对应一条数据),
对应的后端:List(对应多条数据),某个对象或者是Map<key, value>
该数据结构从后端返回的数据应该是一个什么样子的呢?List
- 后台接口封装该数据结构所需要的数据
echarts官网
echarts官网(新版):https://echarts.apache.org/examples/zh/index.html
echarts官网(旧版):https://echarts.apache.org/v4/examples/zh/index.html
echarts安装与使用
cd vue(视情况而定)
npm install echarts --save
import * as echarts from "echarts";
数据结构
// 平滑折线图
let lineOptions = {
  title: {
    text: '最近一周每天平台用户发布的帖子数量',
    subtext: '统计维度:最近一周',
    left: 'center'
  },
  legend: {
    data: [],
    template:""
  },
  grid: {
    left: '3%',
    right: '4%',
    bottom: '3%',
    containLabel: true
  },
  tooltip: {
    trigger: 'item'
  },
  xAxis: {
    name: '日期',
    type: 'category',
    data: ['Mon', 'Tue', 'Wed', 'Thu', 'Fri', 'Sat', 'Sun']
  },
  yAxis: {
    name: '攻略数量',
    type: 'value'
  },
  series: [
    {
      name: '攻略数量',
      data: [820, 932, 901, 934, 1290, 1330, 1320],
      type: 'line',
      smooth: true,
      markLine: {
        data: [{ type: 'average', name: '最近一周场攻略发布数量平均值' }]
      },
      markPoint: {
        data: [
          { type: 'max', name: '最大值' },
          { type: 'min', name: '最小值' }
        ]
      },
    },
  ]
};
// 柱状图
let barOptions = {
  title: {
    text: '不同用户发布帖子数量Top5', // 主标题
    subtext: '统计维度:用户昵称', // 副标题
    left: 'center'
  },
  grid : {   // ---------------------------增加这个属性,bottom就是距离底部的距离
    top: '20%',
    bottom : '20%'
  },
  legend: {
    orient: 'vertical',
    left: 'left'
  },
  xAxis: {
    type: 'category',
    data: ['Mon', 'Tue', 'Wed', 'Thu', 'Fri', 'Sat', 'Sun'], // 示例数据:统计的维度(横坐标)
    name: '用户昵称',
    axisLabel: {
      show: true, // 是否显示刻度标签,默认显示
      interval: 0, // 坐标轴刻度标签的显示间隔,在类目轴中有效;默认会采用标签不重叠的策略间隔显示标签;可以设置成0强制显示所有标签;如果设置为1,表示『隔一个标签显示一个标签』,如果值为2,表示隔两个标签显示一个标签,以此类推。
      rotate: -60, // 刻度标签旋转的角度,在类目轴的类目标签显示不下的时候可以通过旋转防止标签之间重叠;旋转的角度从-90度到90度
      inside: false, // 刻度标签是否朝内,默认朝外
      margin: 6, // 刻度标签与轴线之间的距离
    },
  },
  yAxis: {
    type: 'value',
    name: '攻略数量',
  },
  tooltip: {
    trigger: 'item',
  },
  series: [
    {
      data: [120, 200, 150, 80, 70, 110, 130], // 示例数据:横坐标维度对应的值(纵坐标)
      type: 'bar',
      itemStyle: {
        normal: {
          color: function () {
            return "#" + Math.floor(Math.random() * (256 * 256 * 256 - 1)).toString(16);
          }
        },
      },
    }
  ]
};
// 饼图
let pieOptions = {
  title: {
    text: '不同分类下用户发布旅游攻略帖子的数量', // 主标题
    subtext: '统计维度:攻略分类', // 副标题
    left: 'center'
  },
  tooltip: {
    trigger: 'item',
    formatter: '{a} <br/>{b} : {c} ({d}%)'
  },
  legend: {
    orient: 'vertical',
    left: 'left'
  },
  series: [
    {
      name: '数量占比', // 鼠标移上去显示内容
      type: 'pie',
      radius: '50%',
      center: ['50%', '60%'],
      data: [
        {value: 1048, name: '瑞幸咖啡'}, // 示例数据:name表示维度,value表示对应的值
        {value: 735, name: '雀巢咖啡'},
        {value: 580, name: '星巴克咖啡'},
        {value: 484, name: '栖巢咖啡'},
        {value: 300, name: '小武哥咖啡'}
      ]
    }
  ]
}
进多少天怎么处理?
Date today = new Date();
DateTime start = DateUtil.offsetDay(today, -90);
List<String> list = DateUtil.rangeToList(start, today, DateField.DAY_OF_YEAR).stream().map(DateUtil::formatDate).toList();
后端接口
@GetMapping("/pie")
public Result pie() {
    List<Map<String, Object>> list = new ArrayList<>();
    // 查询出所有的分类信息
    List<Category> categories = categoryService.selectAll(new Category());
    // 查询出所有的帖子信息
    List<Introduction> introductions = introductionService.selectAll(new Introduction());
    for (Category category : categories) {
        long count = introductions.stream().filter(x -> category.getId().equals(x.getCategoryId())).count();
        Map<String, Object> map = new HashMap<>();
        map.put("name", category.getTitle());
        map.put("value", count);
        list.add(map);
    }
    return Result.success(list);
}

@GetMapping("/bar")
public Result bar() {
    Map<String, Object> resultMap = new HashMap<>();
    List<String> xList = new ArrayList<>();
    List<Long> yList = new ArrayList<>();

    Map<String, Long> map = new HashMap<>();

    // 查询所有的用户
    List<User> users = userService.selectAll(new User());
    // 查询出所有的帖子信息
    List<Introduction> introductions = introductionService.selectAll(new Introduction());
    for (User user : users) {
        long count = introductions.stream().filter(x -> user.getId().equals(x.getUserId())).count();
        map.put(user.getName(), count);
    }

    // 对map进行排序,按照value来倒序
    LinkedHashMap<String, Long> collectMap = map.entrySet().stream()
            .sorted(Collections.reverseOrder(Map.Entry.comparingByValue()))
            .collect(Collectors.toMap(Map.Entry::getKey, Map.Entry::getValue, (e1, e2) -> e1, LinkedHashMap::new));

    for (String key : collectMap.keySet()) {
        xList.add(key);
        yList.add(collectMap.get(key));
    }

    // top几的的问题,截断一下
    if (xList.size() > 5 && yList.size() > 5) {
        xList = xList.subList(0, 5);
        yList = yList.subList(0, 5);
    }

    resultMap.put("xAxis", xList);
    resultMap.put("yAxis", yList);
    return Result.success(resultMap);
}

@GetMapping("/line")
public Result line() {
    Map<String, Object> resultMap = new HashMap<>();
    List<Long> yList = new ArrayList<>();

    // 获取最近多少天的年月日List
    Date today = new Date();
    DateTime start = DateUtil.offsetDay(today, -7);
    List<String> xList = DateUtil.rangeToList(start, today, DateField.DAY_OF_YEAR).stream().map(DateUtil::formatDate).toList();

    // 把所有的帖子查出来
    List<Introduction> introductions = introductionService.selectAll(new Introduction());

    for (String day : xList) {
        long count = introductions.stream().filter(x -> ObjectUtil.isNotEmpty(x.getTime()) && x.getTime().contains(day)).count();
        yList.add(count);
    }

    resultMap.put("xAxis", xList);
    resultMap.put("yAxis", yList);
    return Result.success(resultMap);
}
问题处理
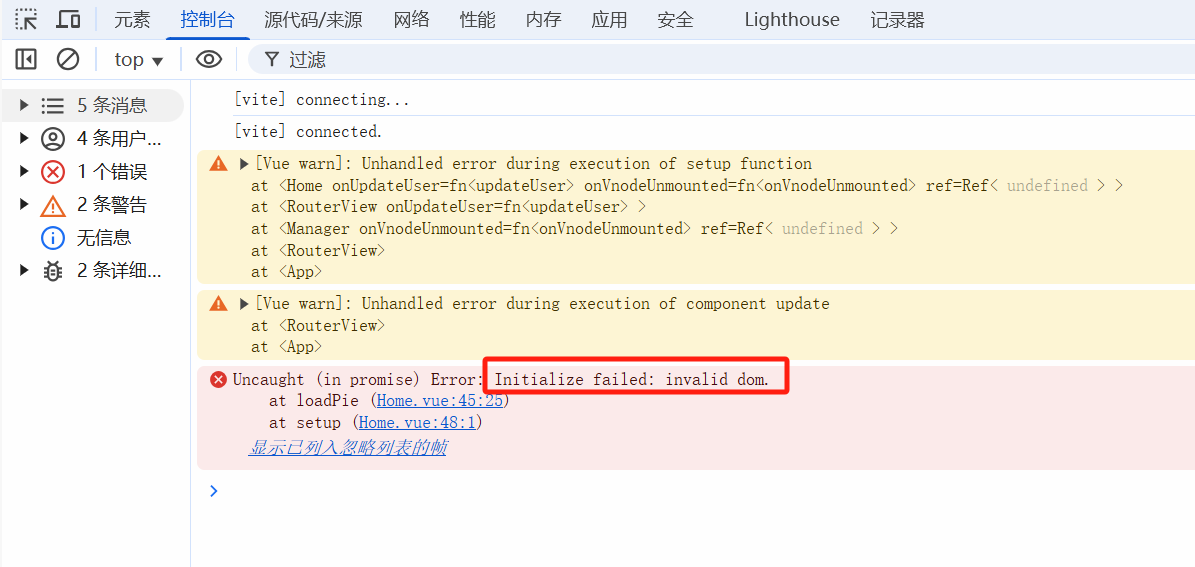
说明dom没法初始化,onMounted是等页面dom元素加载完毕之后开始执行。